
Are the bulls going to be able to seize the initiative and seize control of the market in the last week of the year?
The majority of the coins were trading in the green zone by the end of the day.
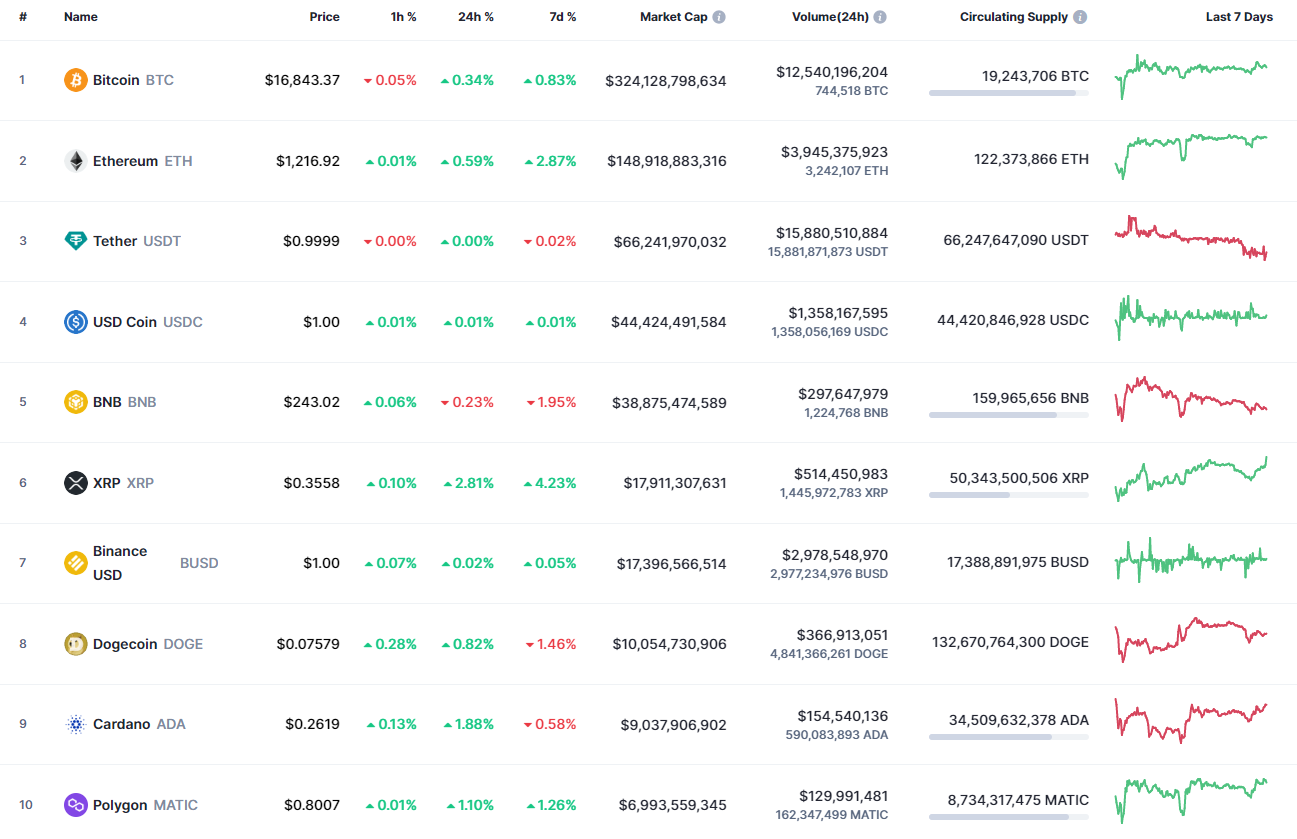
BTC/USD
In comparison to most of the altcoins, Bitcoin (BTC) is performing worse than most of the others, rising only by 0.34%.
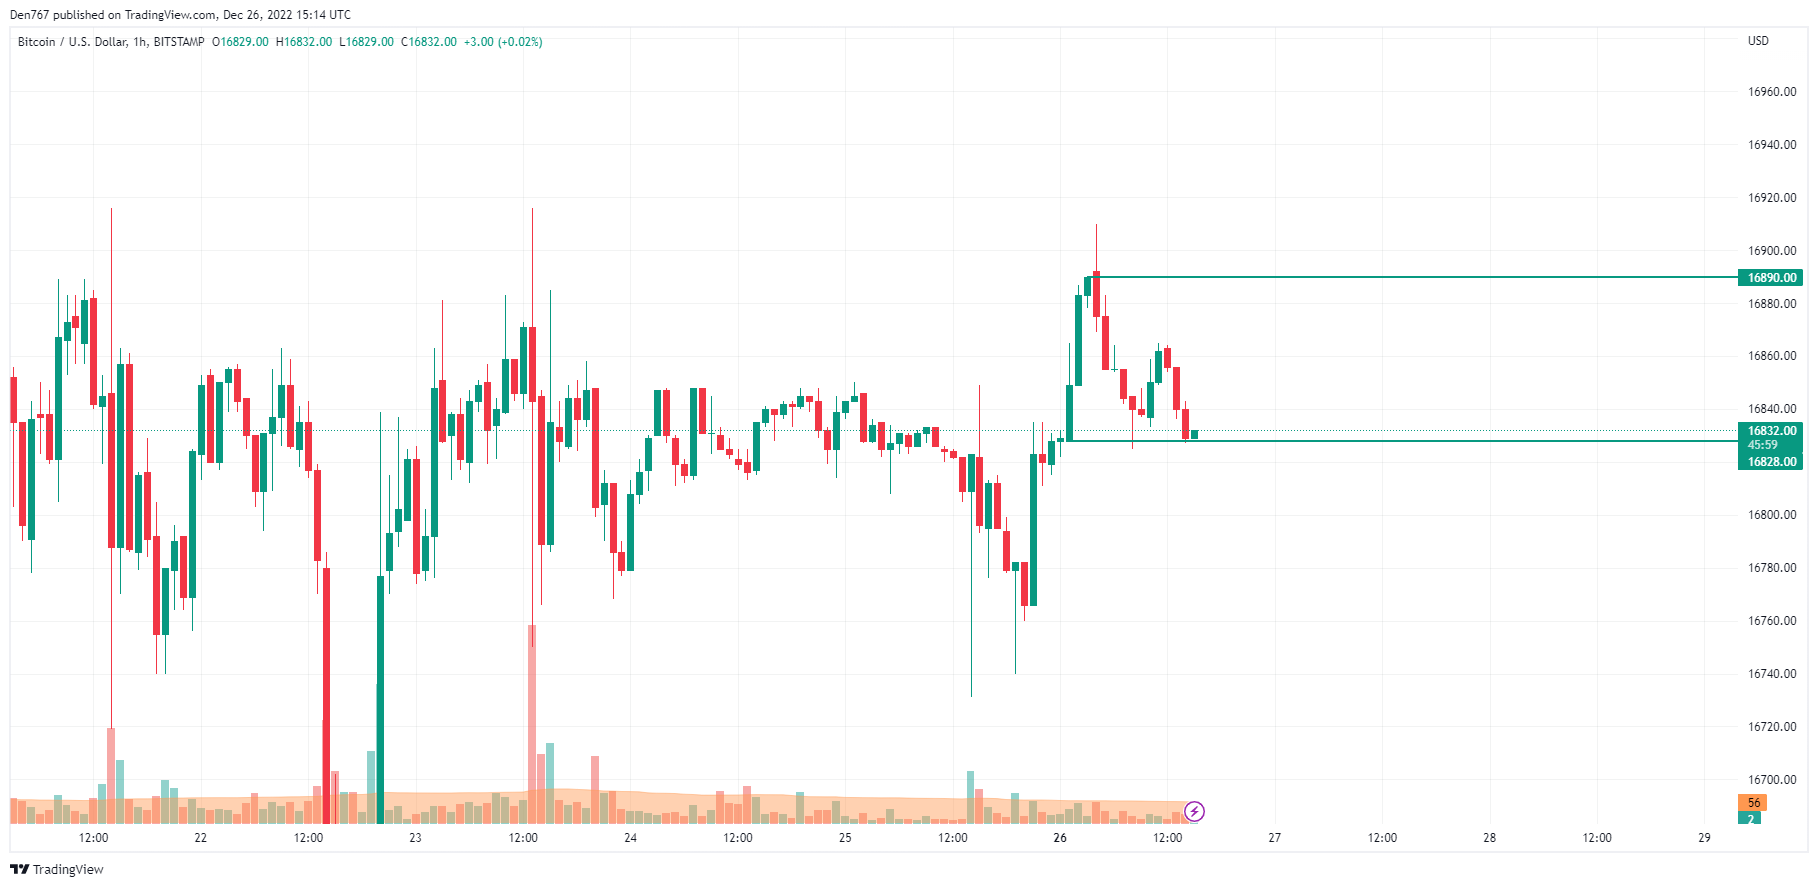
The hourly chart clearly illustrates the bearish impulse, as the price cannot rise after the false breakout of the support level on the hourly chart. The more likely scenario in this case is for the index to decline, followed by a test of the $16,760 zone in the near future.
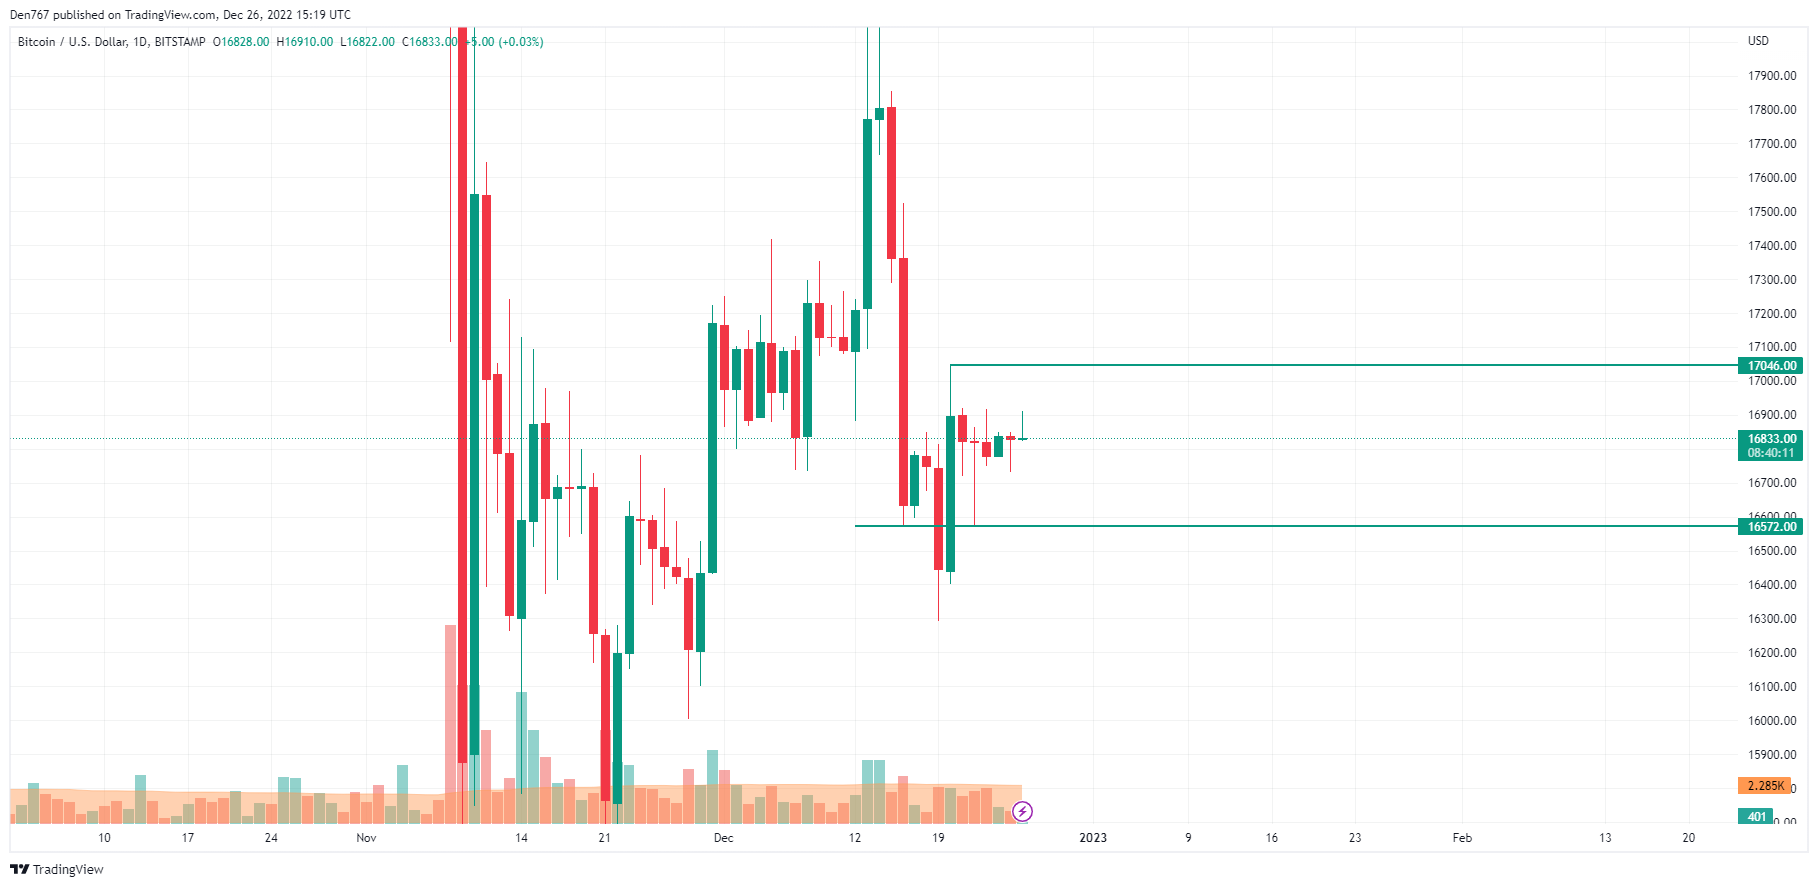
Bitcoin (BTC) has not yet accumulated enough strength on the daily timeframe, so the situation remains unchanged. As of right now, $16,700 is the current interim support level at which the market is trading.
It is possible that the fall will continue to the $16,572 mark within the next few days if the candle fixes below it.
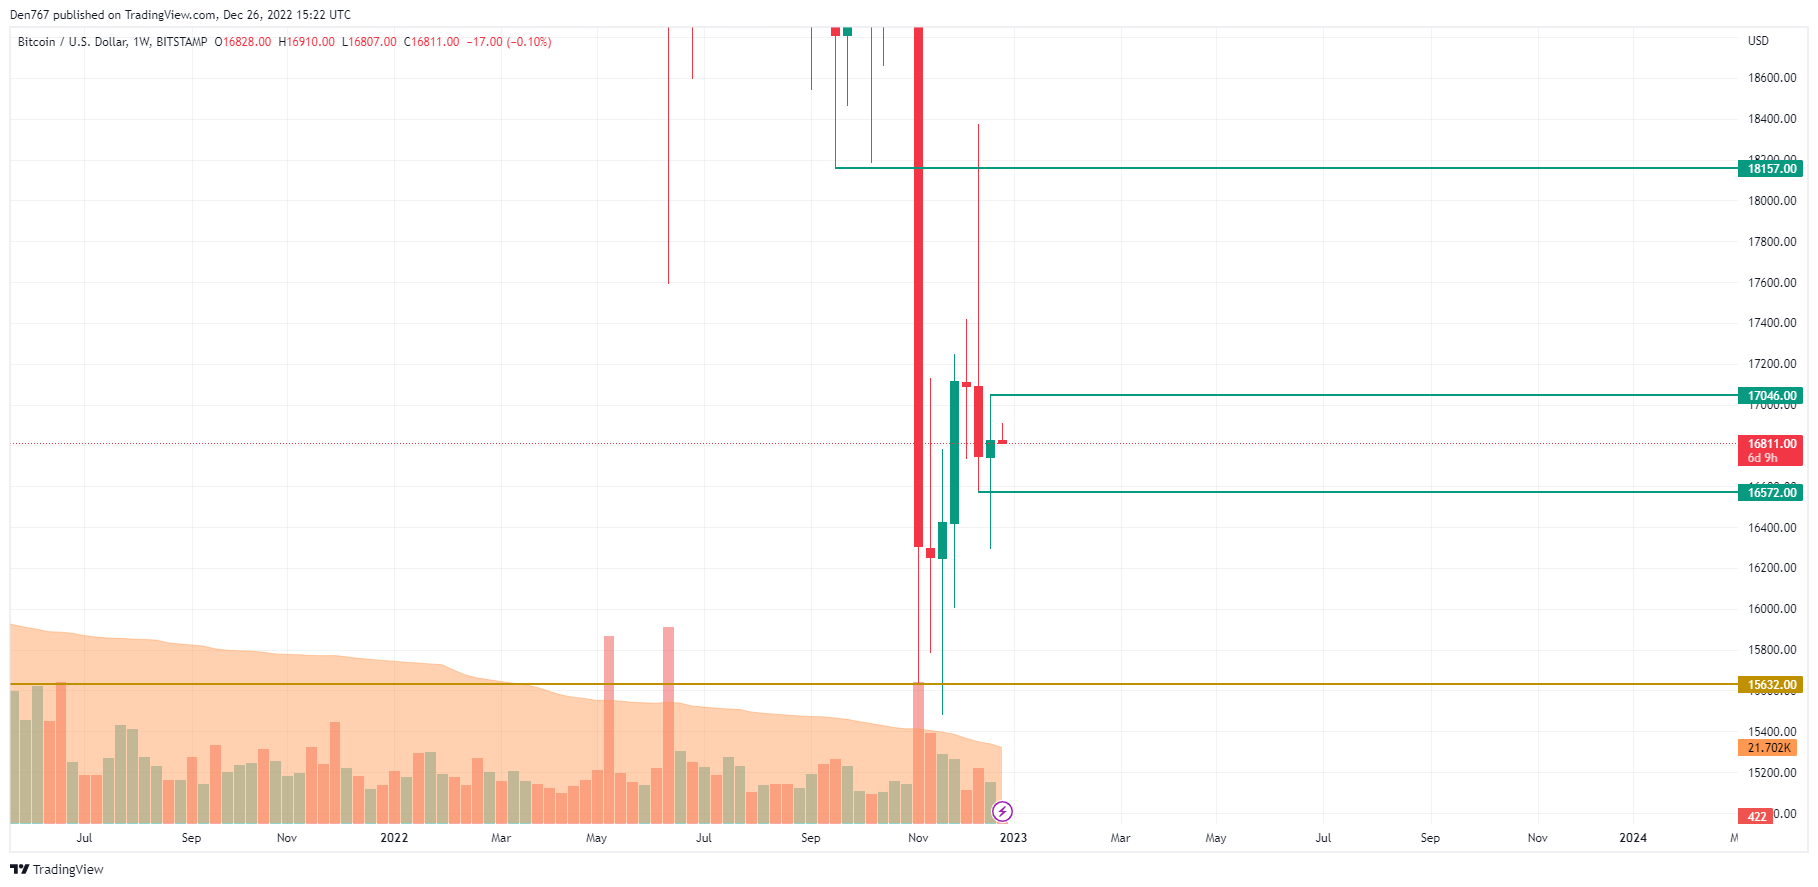
A similar picture can be seen on the weekly chart, where the rate is trading within the previous bar. At the moment, it is too early to make any predictions about the price, as it is only the first day of the week. As a result, traders may have to wait a few days before they can see the rate of BTC fall to around $16,500 if buyers are unable to seize the initiative.
Post Disclaimer
Please note that the opinions shared here are for informational purposes and not meant to be considered investment advice. Each writer expresses their own views, which may not necessarily reflect those of the platform. All investments and trading carry risks, so it is important to conduct thorough research before making any decisions. It is important to only invest money that you can afford to lose, as this author & Financial Futruism is not responsible for any financial losses resulting from investments or cryptocurrency trading.