Cryptocurrencies are popular among people hoping to make a significant profit, but they carry the risk of loss as well. Cryptocurrencies can be analyzed using the fear and greed index to determine their risk/reward ratio.
Investors often buy assets when they are undervalued out of fear, and sell them when they are overvalued out of greed, according to the saying, “buy the fear, sell the greed.”
Both greed and fear can influence price movements. Investors’ fear of losses leads them to sell assets. Alternatively, investors may choose to buy assets more often if they are feeling greed for a particular offering. Price rises can be triggered by this.
There is no doubt that perfectly timing the market is not always possible. Investing can be easier when investors understand how fear and greed affect prices.
Data-driven investors can use the Fear and Greed Index to remove emotions from the equation.
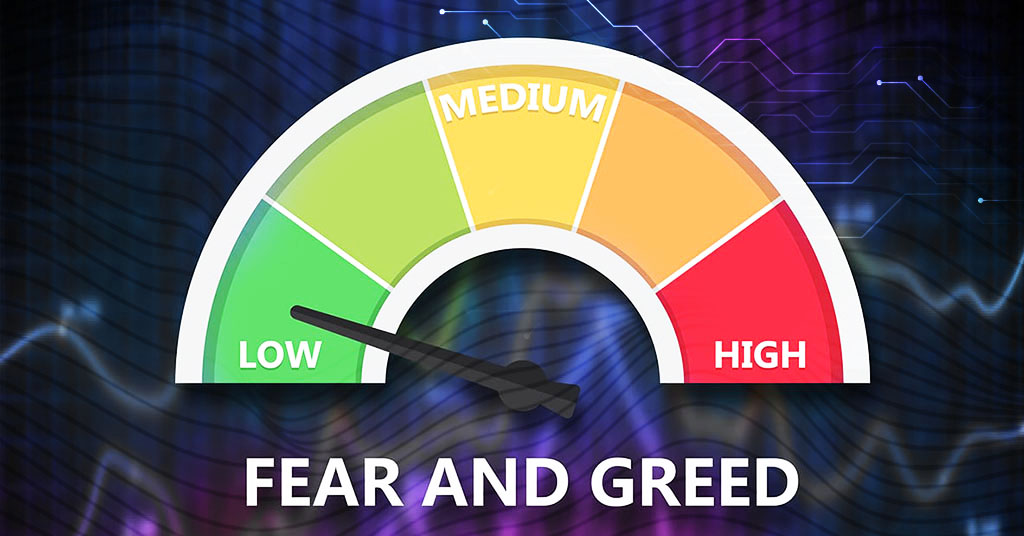
Fear & Greed Index Explained
In the crypto market, the Fear & Greed Index measures sentiment. To calculate the market’s “fear and greed” score, various exchanges and news sources are used. Higher scores correspond to more “fearful” conditions, while lower scores correspond to more “greedy” conditions.
Arcane Research created the index and updates it daily. This tool aims to help crypto investors make more informed investment decisions by providing a quick snapshot of market sentiment.
During the crypto market crash in December 2017, the index hit an all-time high of 100. During another tough period in December 2018, the index hit a low of 27.
Fear & Greed Index: What Does It Mean to Investors?
A quick snapshot of market sentiment can be provided by the Fear & Greed Index for crypto investors. In making investment decisions, the Fear & Greed Index should be used as one of many factors, not as a perfect indicator. Market sentiment can be gleaned from it, however.
How Fear and Greed Are Calculated
The Fear and Greed Index was created to help investors understand how they feel about the market at any given moment in time. A number of indicators are taken into account when determining the market sentiment, such as volatility, momentum, and volume.
In order to calculate its reading, the index takes into account a number of factors. The overall market capitalization of Bitcoin is a fairly simple indicator, but there are a number of others as well. There are other indicators that are more complex, such as the ratio of put options to call options or the amount of news coverage in the industry.
These indicators are:
Social Media Volume. As a formula, we calculate social media volume by taking the total number of tweets posted over a period of time about certain cryptos. We then divide that number by the total number of tweets posted about all cryptocurrencies. On the basis of this analysis, we can determine how much attention the two largest cryptocurrencies are getting on social media. An investor’s sentiment can also be determined by the amount of news coverage a company receives. In general, a lot of news coverage means a lot of interest in an asset, which can either be positive or negative.
Market Volatility. As a measure of market volatility, the daily returns’ standard deviation over a given period of time is taken. As a result, we can get a sense of how volatile the market is on a daily basis.
Market Dominance. Dominance is simply a measure of how much a crypto makes up the overall market cap, expressed as a percentage. The importance of Bitcoin to the overall market can be seen from this fact.
Transactions per day. The number of transactions per day indicates how much activity is happening on the blockchain daily. Therefore, we can see how much cryptocurrency is being used.
Search Term Popularity. There is no doubt that the more often an asset is searched, the more interest it has. By dividing the number of Google searches for crypto over a period of time by the total number of Google searches for all cryptocurrencies, we can determine the popularity of search terms. In this way, we can see what cryptocurrencies are most popular.
Price Change Over Time. Changes in price over a period of time indicate how much the price has adjusted since the last time it was measured. As a result, we can get a good idea of how volatile the market is.
Exchange Inflow/Outflow Ratio. The put/call ratio measures the number of put options (options to sell a security at a certain price depending on the market conditions) relative to call options (options to buy a security at a certain price depending on the market conditions). It is considered that a high put/call ratio indicates that investors are more concerned about the possibility of a drop in the underlying asset price than they are about the possibility of a rise in the asset price.
Technical Indicators. There are a number of technical indicators that traders can use to identify trends in the market based on mathematics. A moving average, a resistance level, and a support level are some of the most popular technical indicators.
As a result, these inputs are combined into a single number between 1-100 that can be interpreted in the following way to determine the Fear and Greed Index for Cryptocurrency:
- 1-33 = Extreme Fear
- 34-66 = Very Fearful
- 67-89 = Neutral/Indifferent
- 90-100 = Extreme Greed
The Fear & Greed Index: Why Should You Use It?
In terms of a crypto investment tool, the Fear and Greed Index can be an extremely useful tool as it can assist crypto investors in making better investment decisions.
The price of crypto will probably fall as investors sell their crypto if the index is in the fear territory. In contrast, if the index is in the greed territory, prices are likely to rise as investors buy crypto when the index is in the greed territory.
It goes without saying that the index is not perfect, and there will be times when it will be out of sync with the market. It has, however, been a relatively accurate predictor of price movements over a period of time.
Overcoming Fear and Greed in Trading
Having a clear and concise trading plan will help you overcome fear and greed. Stop losses and entry and exit points should be included in this plan. Your emotions will be kept in check when you know what to do when you enter and exit a trade.
Staying disciplined in your trading also overcomes fear and greed. Keep your plan and avoid lettingr emotions lead you astray. Discipline allows you to take advantage of opportunities while avoiding pitfalls.
Risk management is the last method for overcoming fear and greed. Don’t trade with money you can’t afford to lose. Protect your account from blowing up with risk management.
Bottom Line
The Cryptocurrency Fear and Greed Index is just one tool that can be used to inform trading decisions. It is intended as an independent contrarian indicator. Always consult a professional before making any investment decisions and ensure that you have developed a strategy by doing your own research.
Post Disclaimer
Please note that the opinions shared here are for informational purposes and not meant to be considered investment advice. Each writer expresses their own views, which may not necessarily reflect those of the platform. All investments and trading carry risks, so it is important to conduct thorough research before making any decisions. It is important to only invest money that you can afford to lose, as this author & Financial Futruism is not responsible for any financial losses resulting from investments or cryptocurrency trading.